Single board computer projects
7 x Serial (EIA232+EIA485) on the BeagleBone
This information is intended to help you to create an own project on a BeagleBone, BeagleBoard or Raspi. With changes on the circuit and the code many other embedded computers may be used.
Short description
My solar power station is using three old data logger (SIC 100) with serial interface (3xEIA232). To monitor our family’s power consumption the teensylogger weigu.lu/microcontroller/teensylogger was created. A second teensylogger is redundantly monitoring the solar power station (2xEIA232). My old heating controller from Resol (thermal solar power and gas) can be accessed via EIA485. And finally I would like to monitor my ventilation (1xEIA232).
I needed a little server to collect an treat all this data. First I used a BeagleBoard-xm with only one serial interface (multiplexing to 4, programmed in c). Than I realized that my old BeagleBone (not black :-)) has 4 serial interfaces. So I switched to the BeagleBone. The code is written in Python using the pybbio library from alexander hiam.
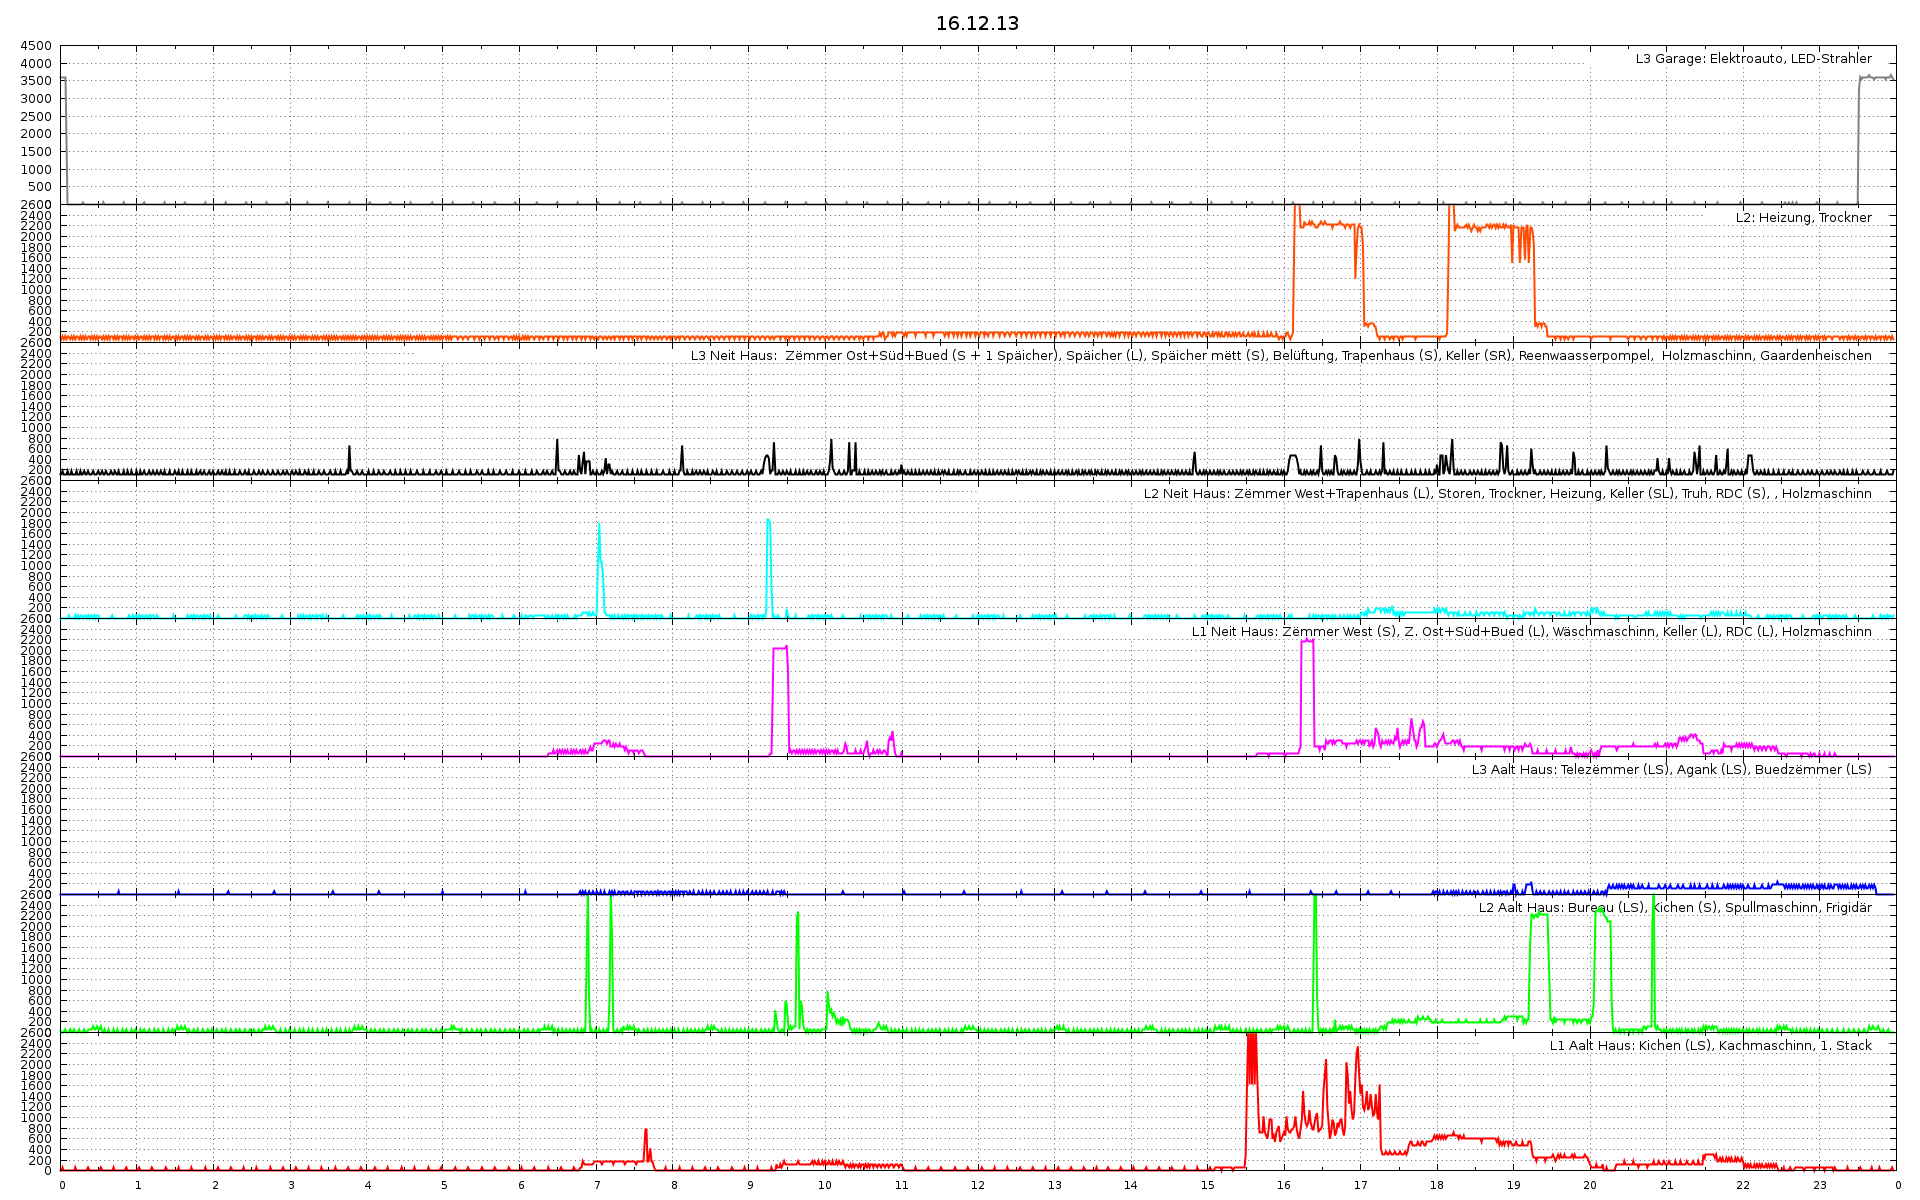
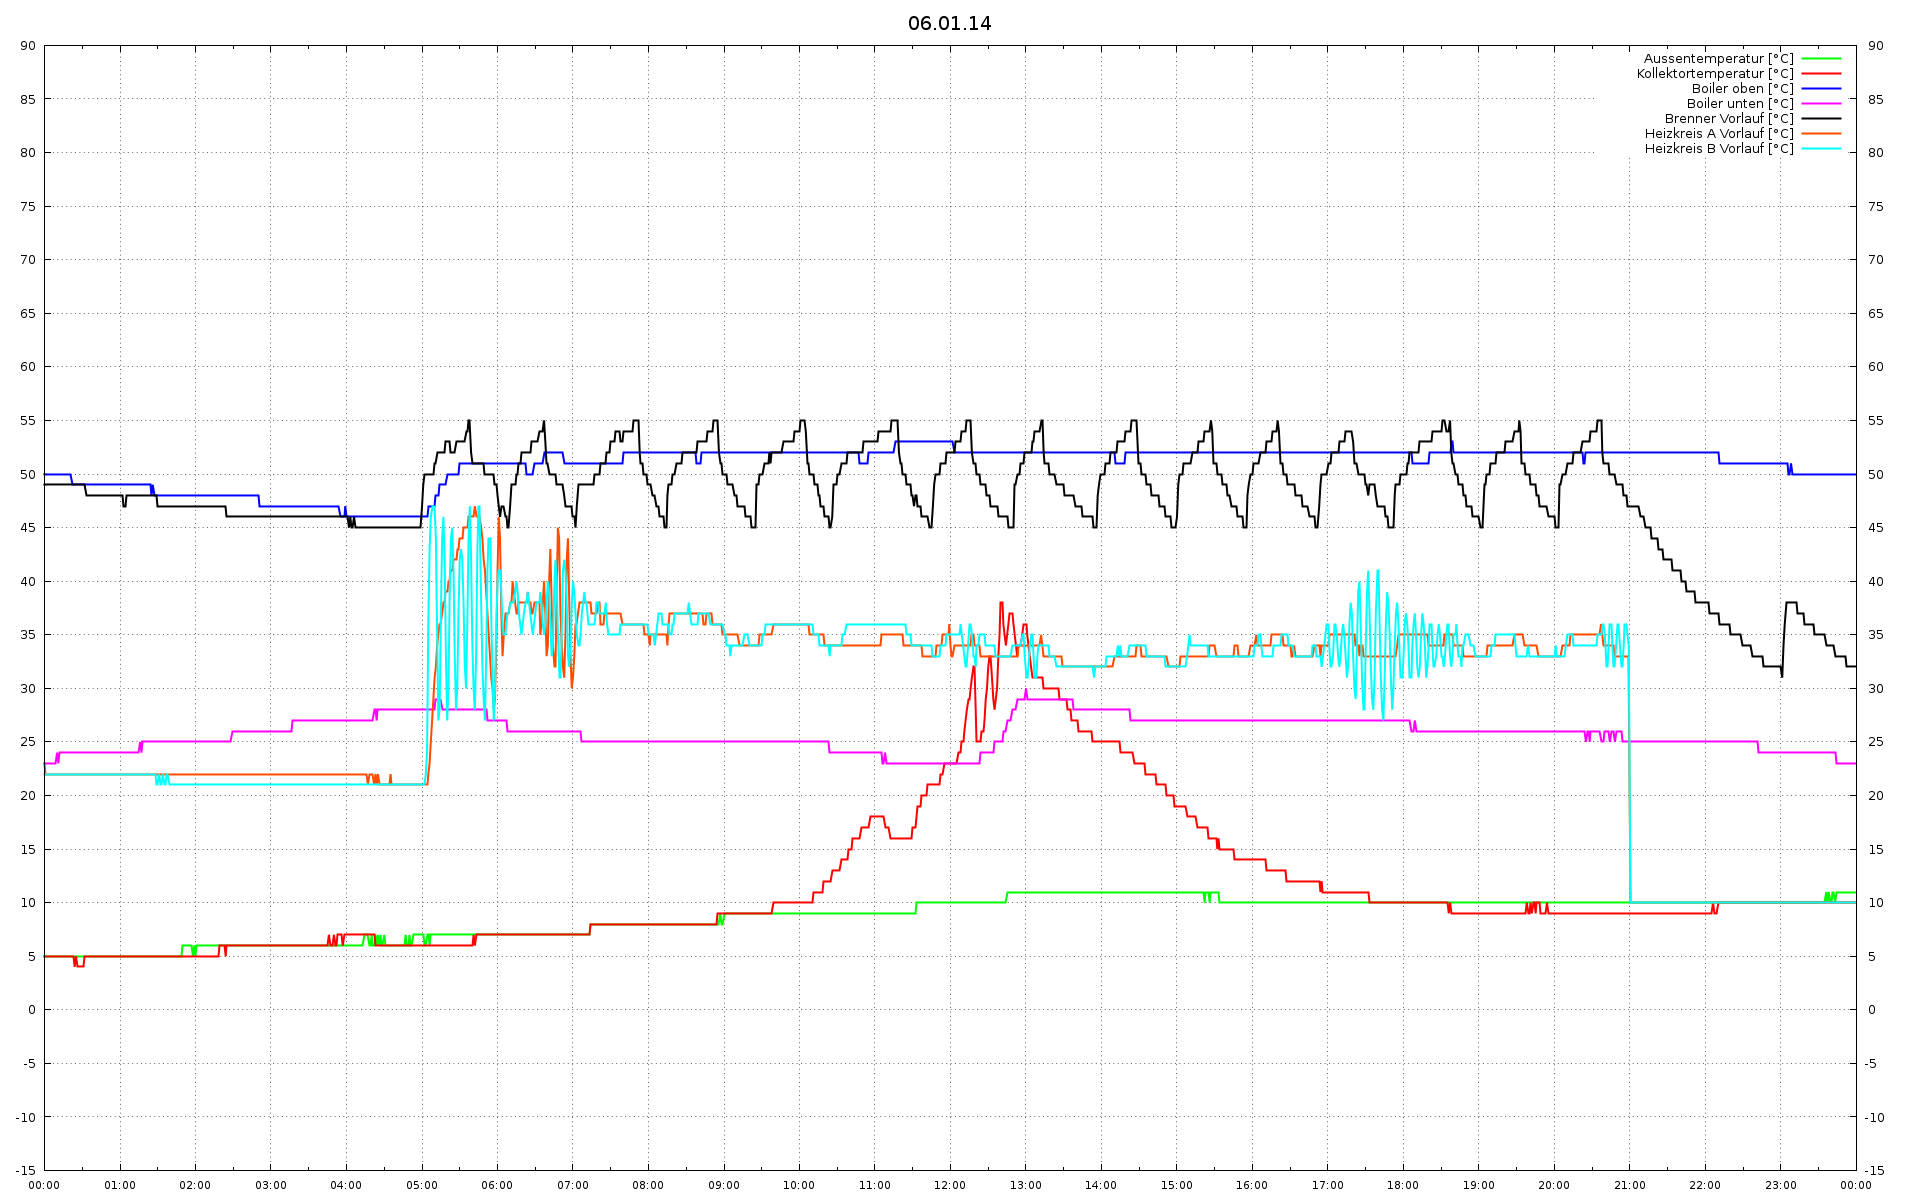
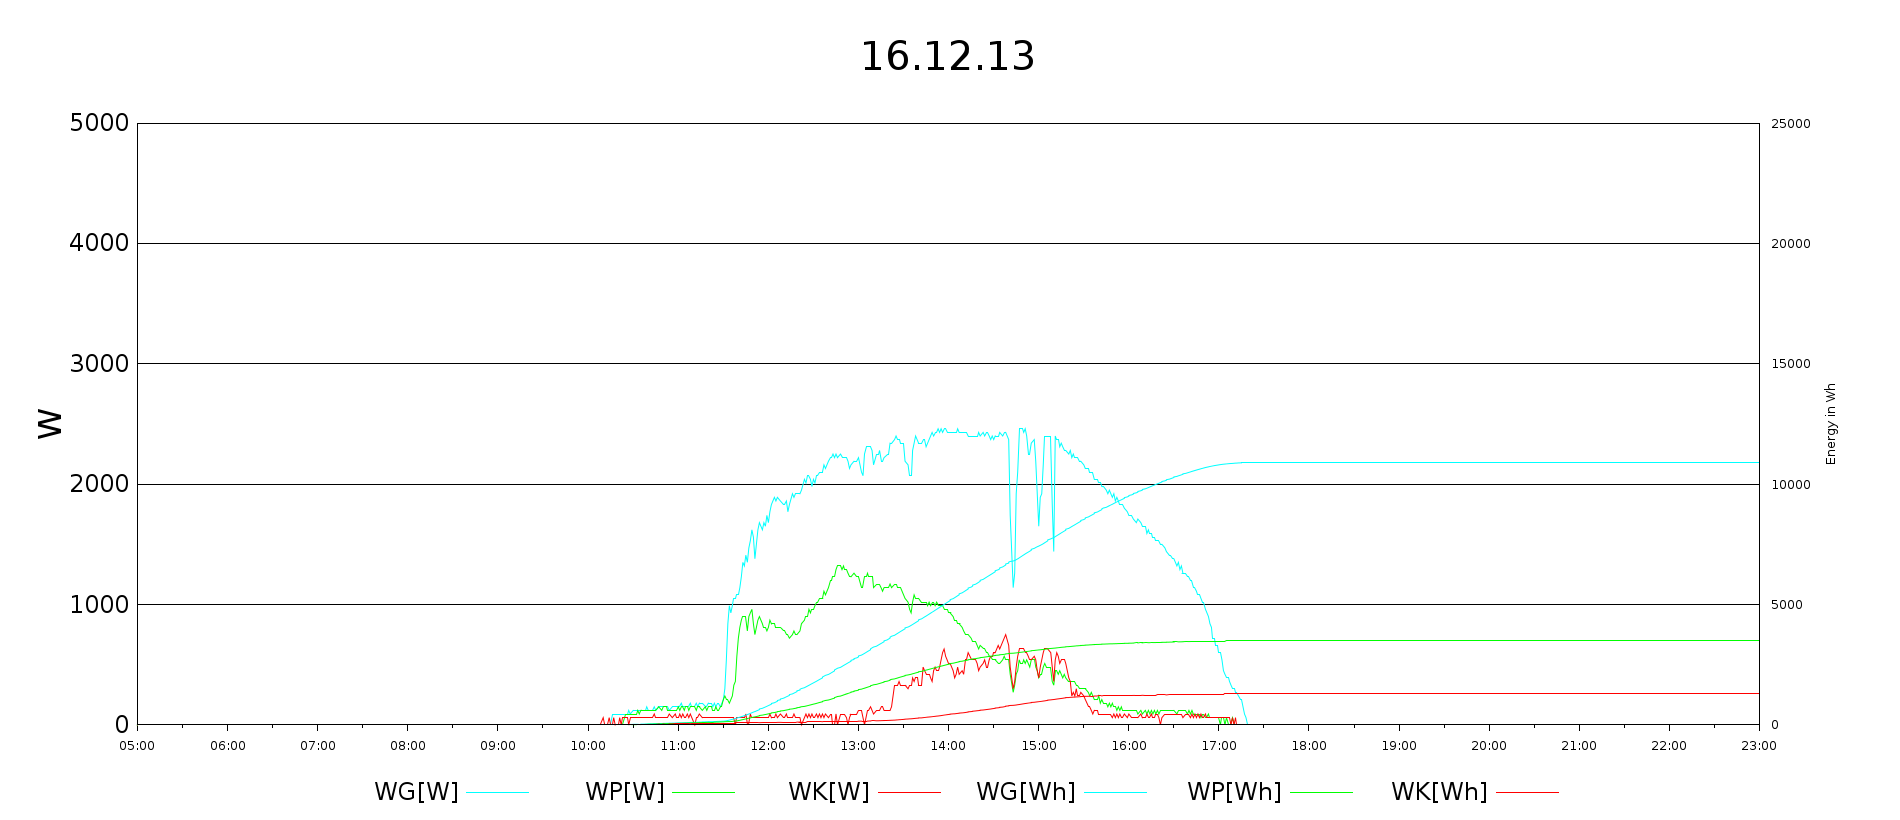
The server is collecting and merging the data from the three sic, the two teensylogger and the heating. The data is archived. The graphics are created with gnuplot, archived and mailed to my mail-account. One graphic is uploaded to this internet server. The result may be seen on weigu.lu/energy.
Here three graphics from the home server: energy consumption, heating and solar power.
7x Serial Expansion Board(s)
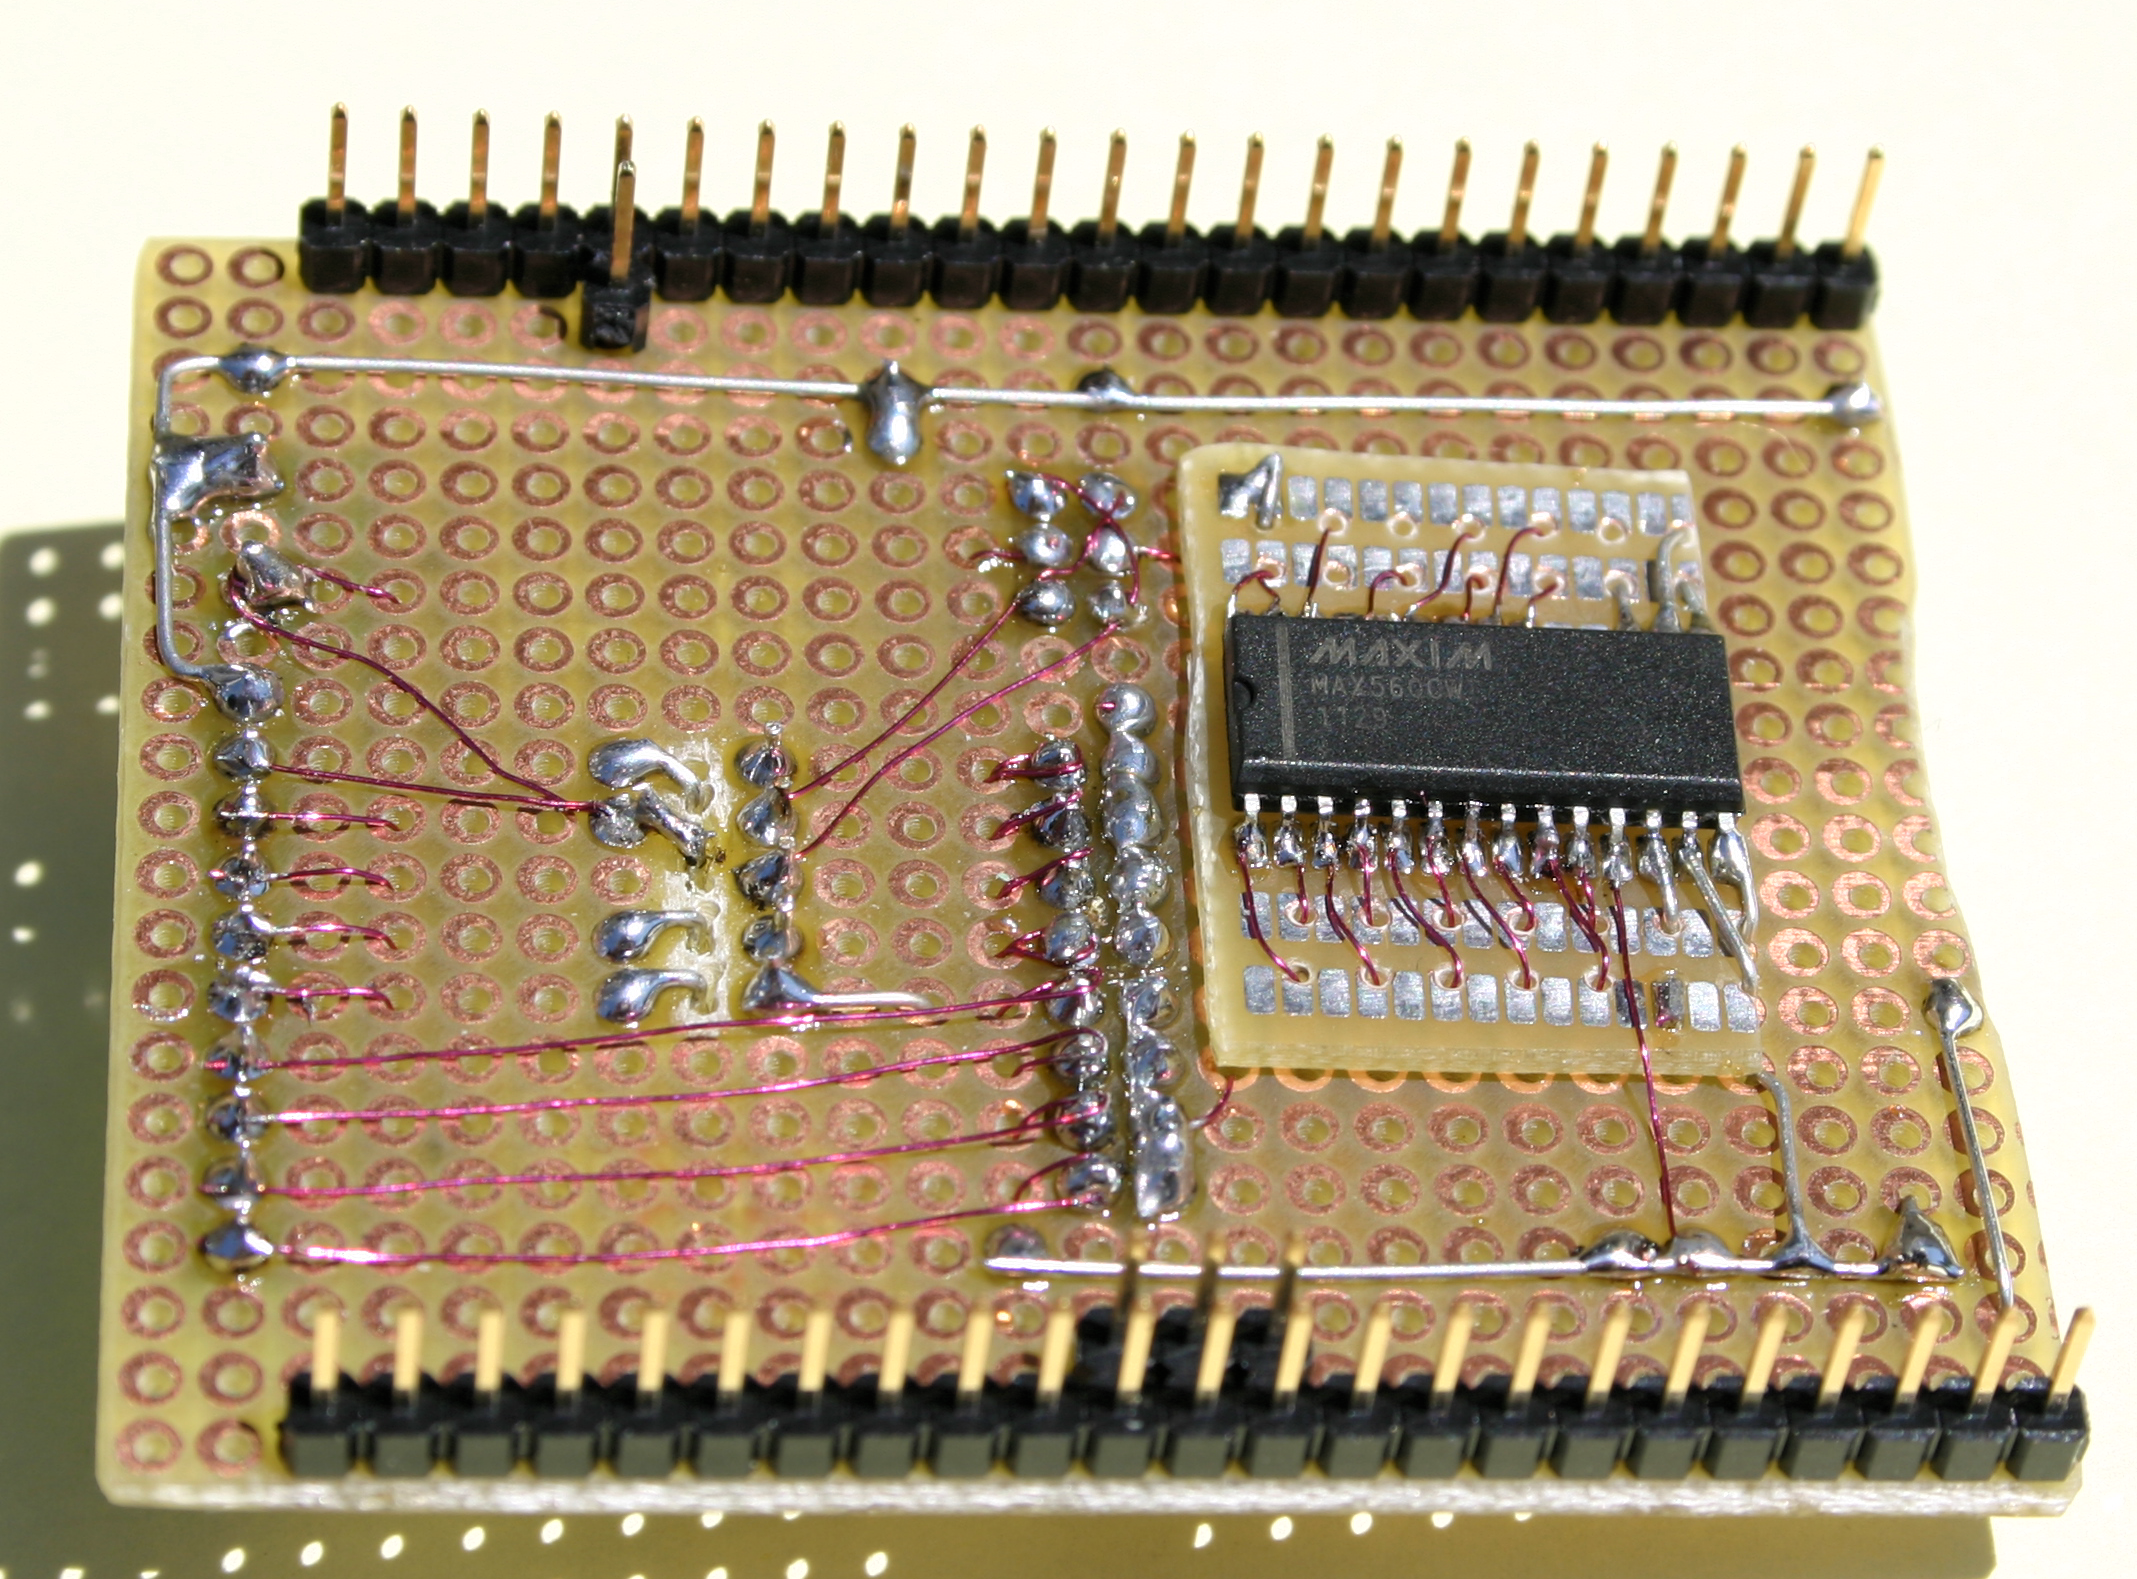
The first expansion board (4xEIA232) was extended with a piggyback board. I have only prototype boards, but the Kicad circuit already exists:
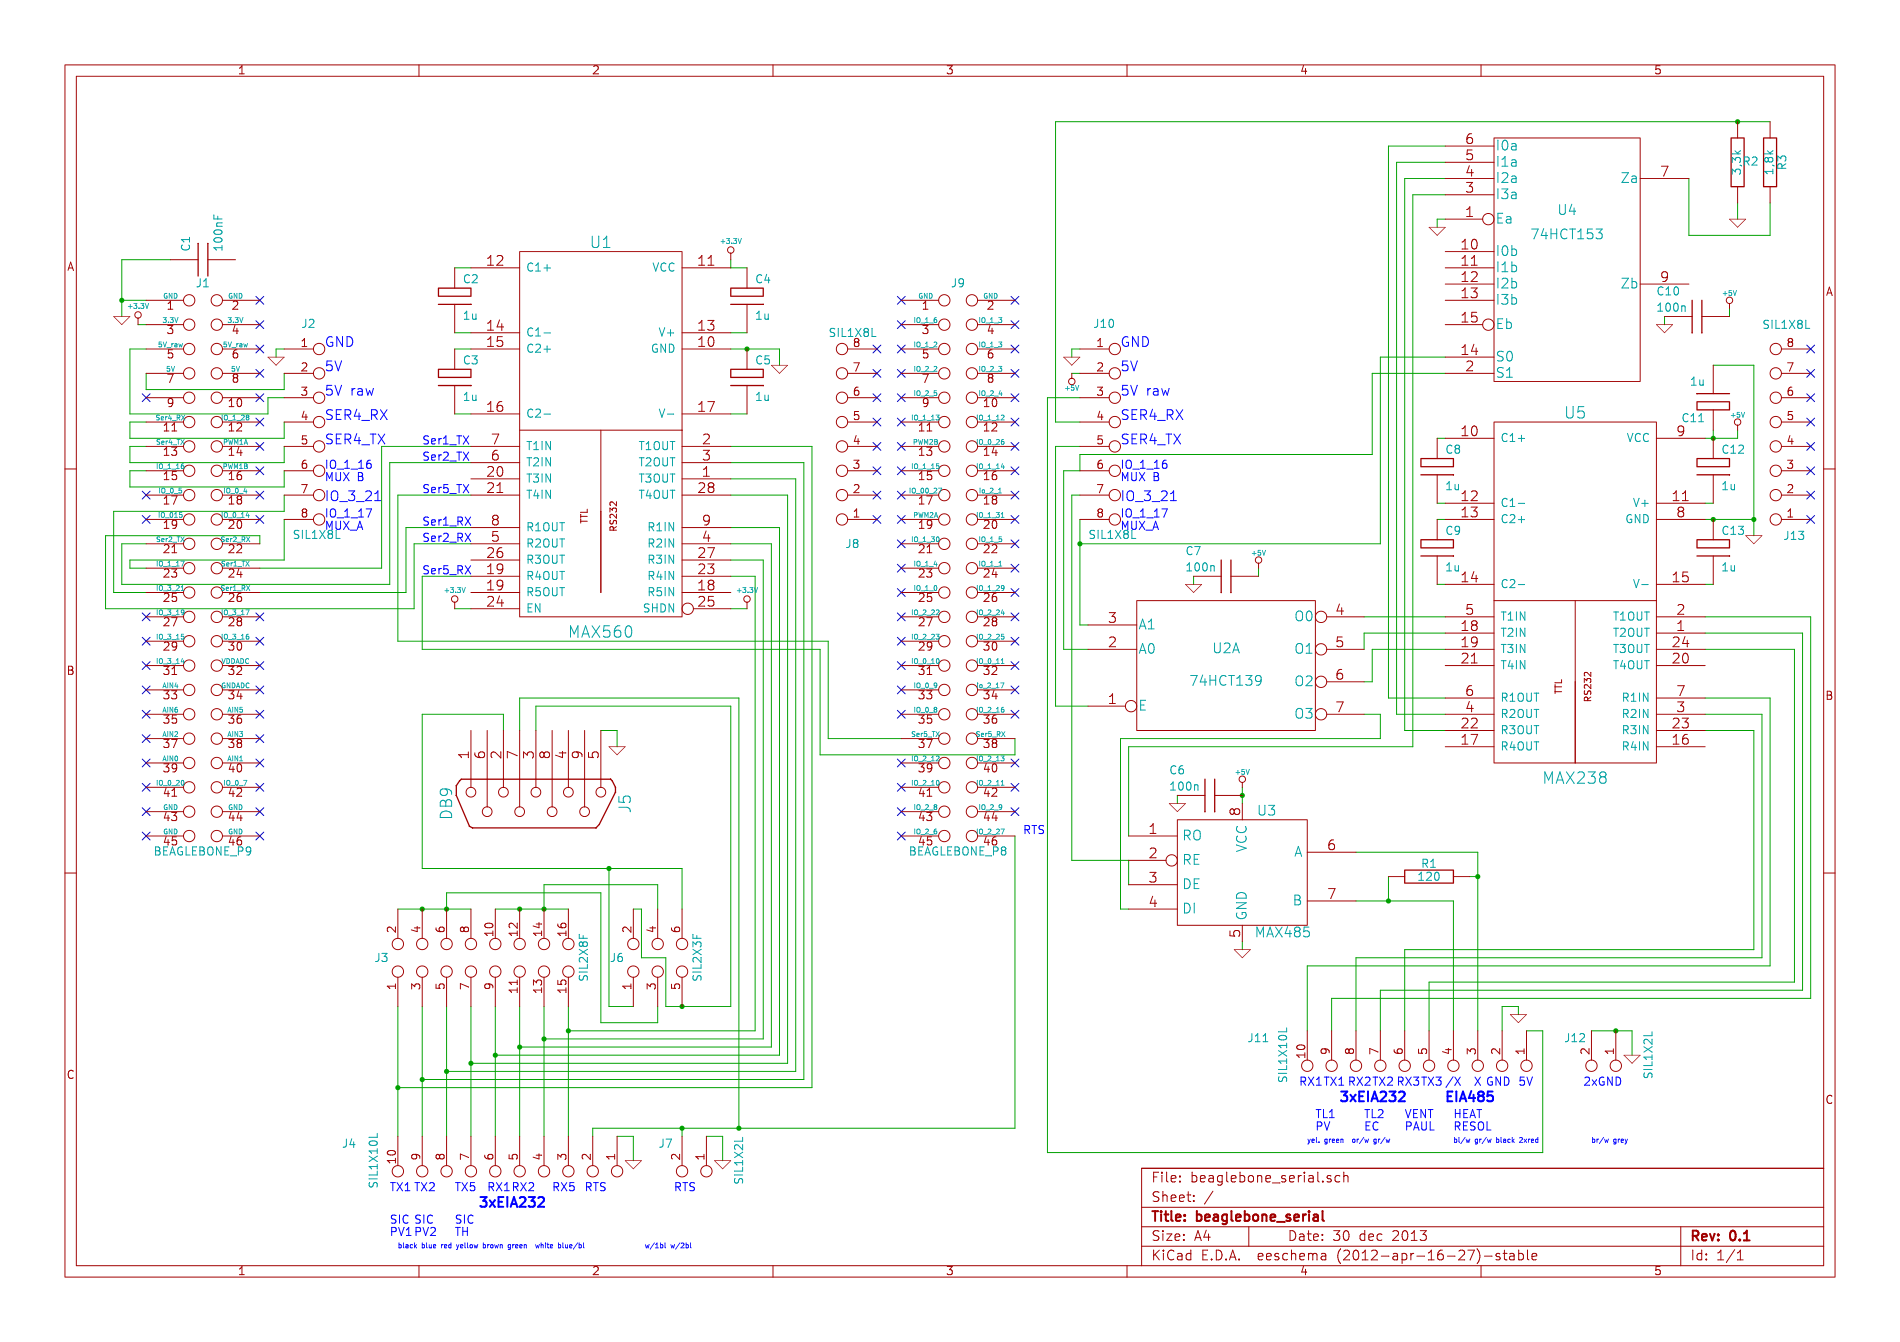
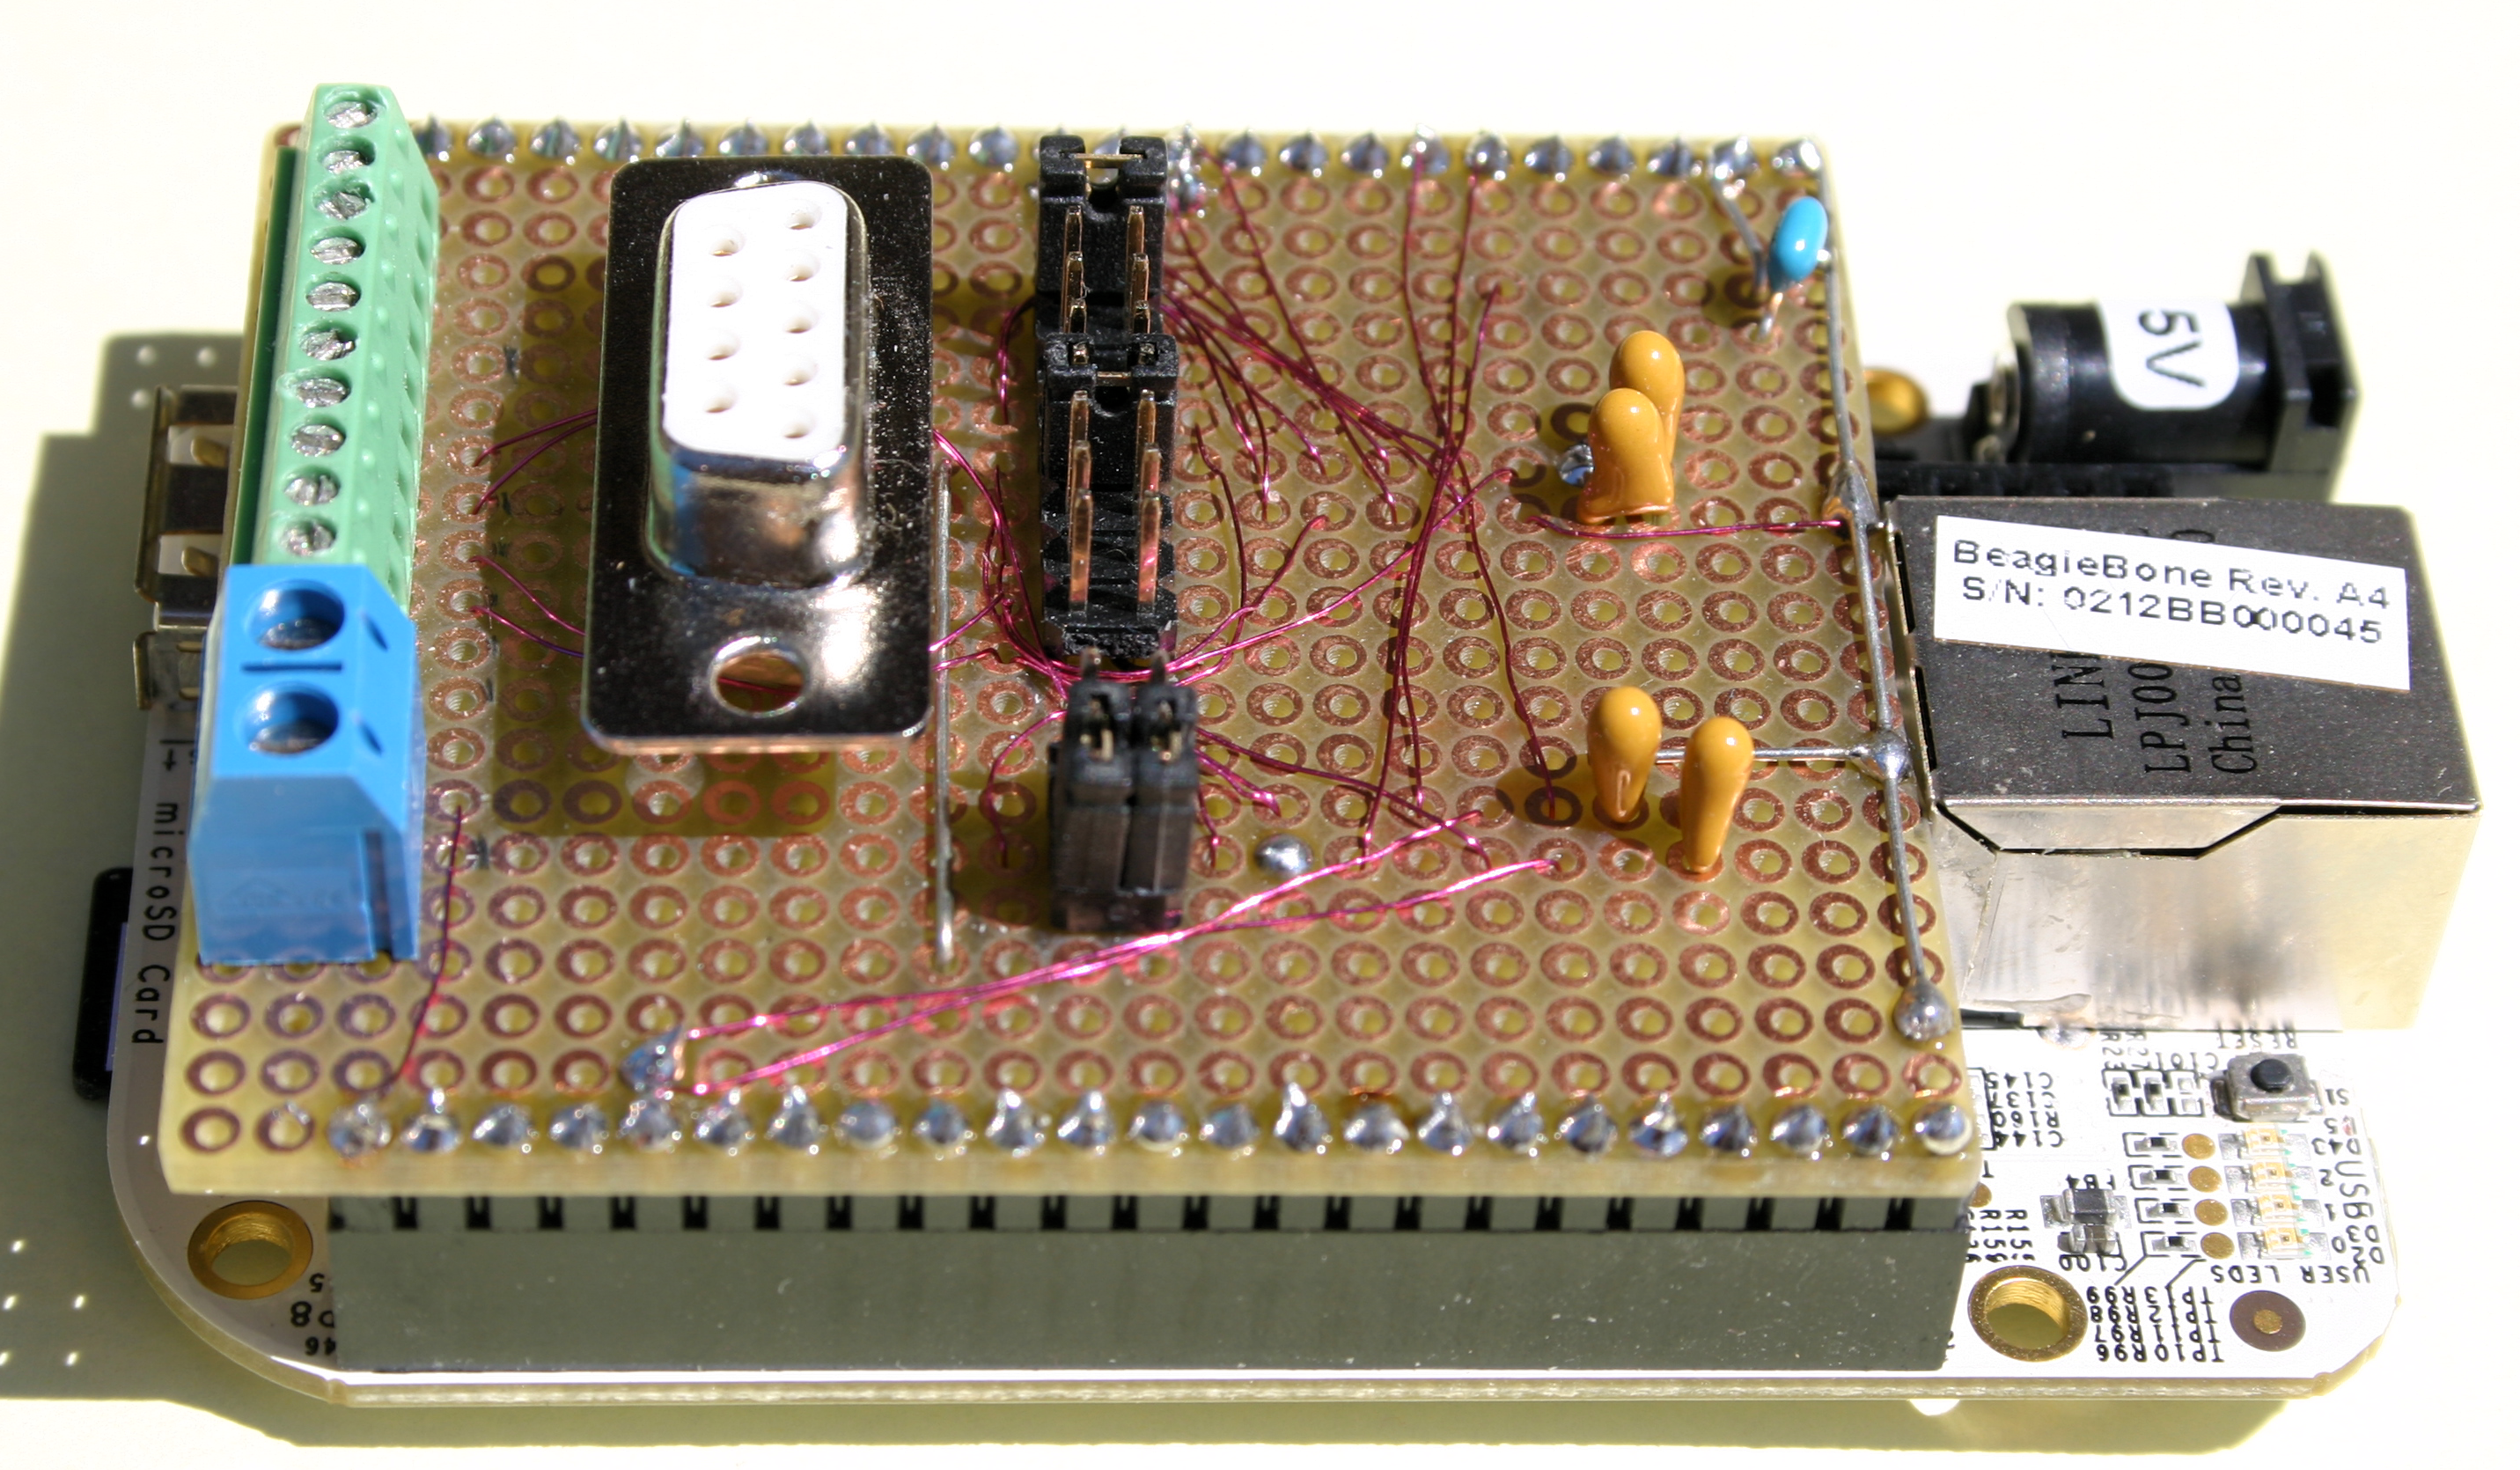
The Max 560 from Maxim has four line drivers, five receivers and the on-board charge-pump voltage converter converts the +3.3V input to ±6.6V needed by EIA232. The sic data loggers need a CTS (Clear To Send) signal. Pin 46 (GPIO 2_7, P8 header) generates the RTS signal (RTS (DTE) is connected to CTS (DCE) with a null modem cable) witch is common for the three ports. The 3.3V are high enough to signal my data logger that the line is active. On the board you see one DE-9 connector. It is possible to connect the DE-9 with one serial port using jumper. The 3 serial ports are available on the screw-type terminals.
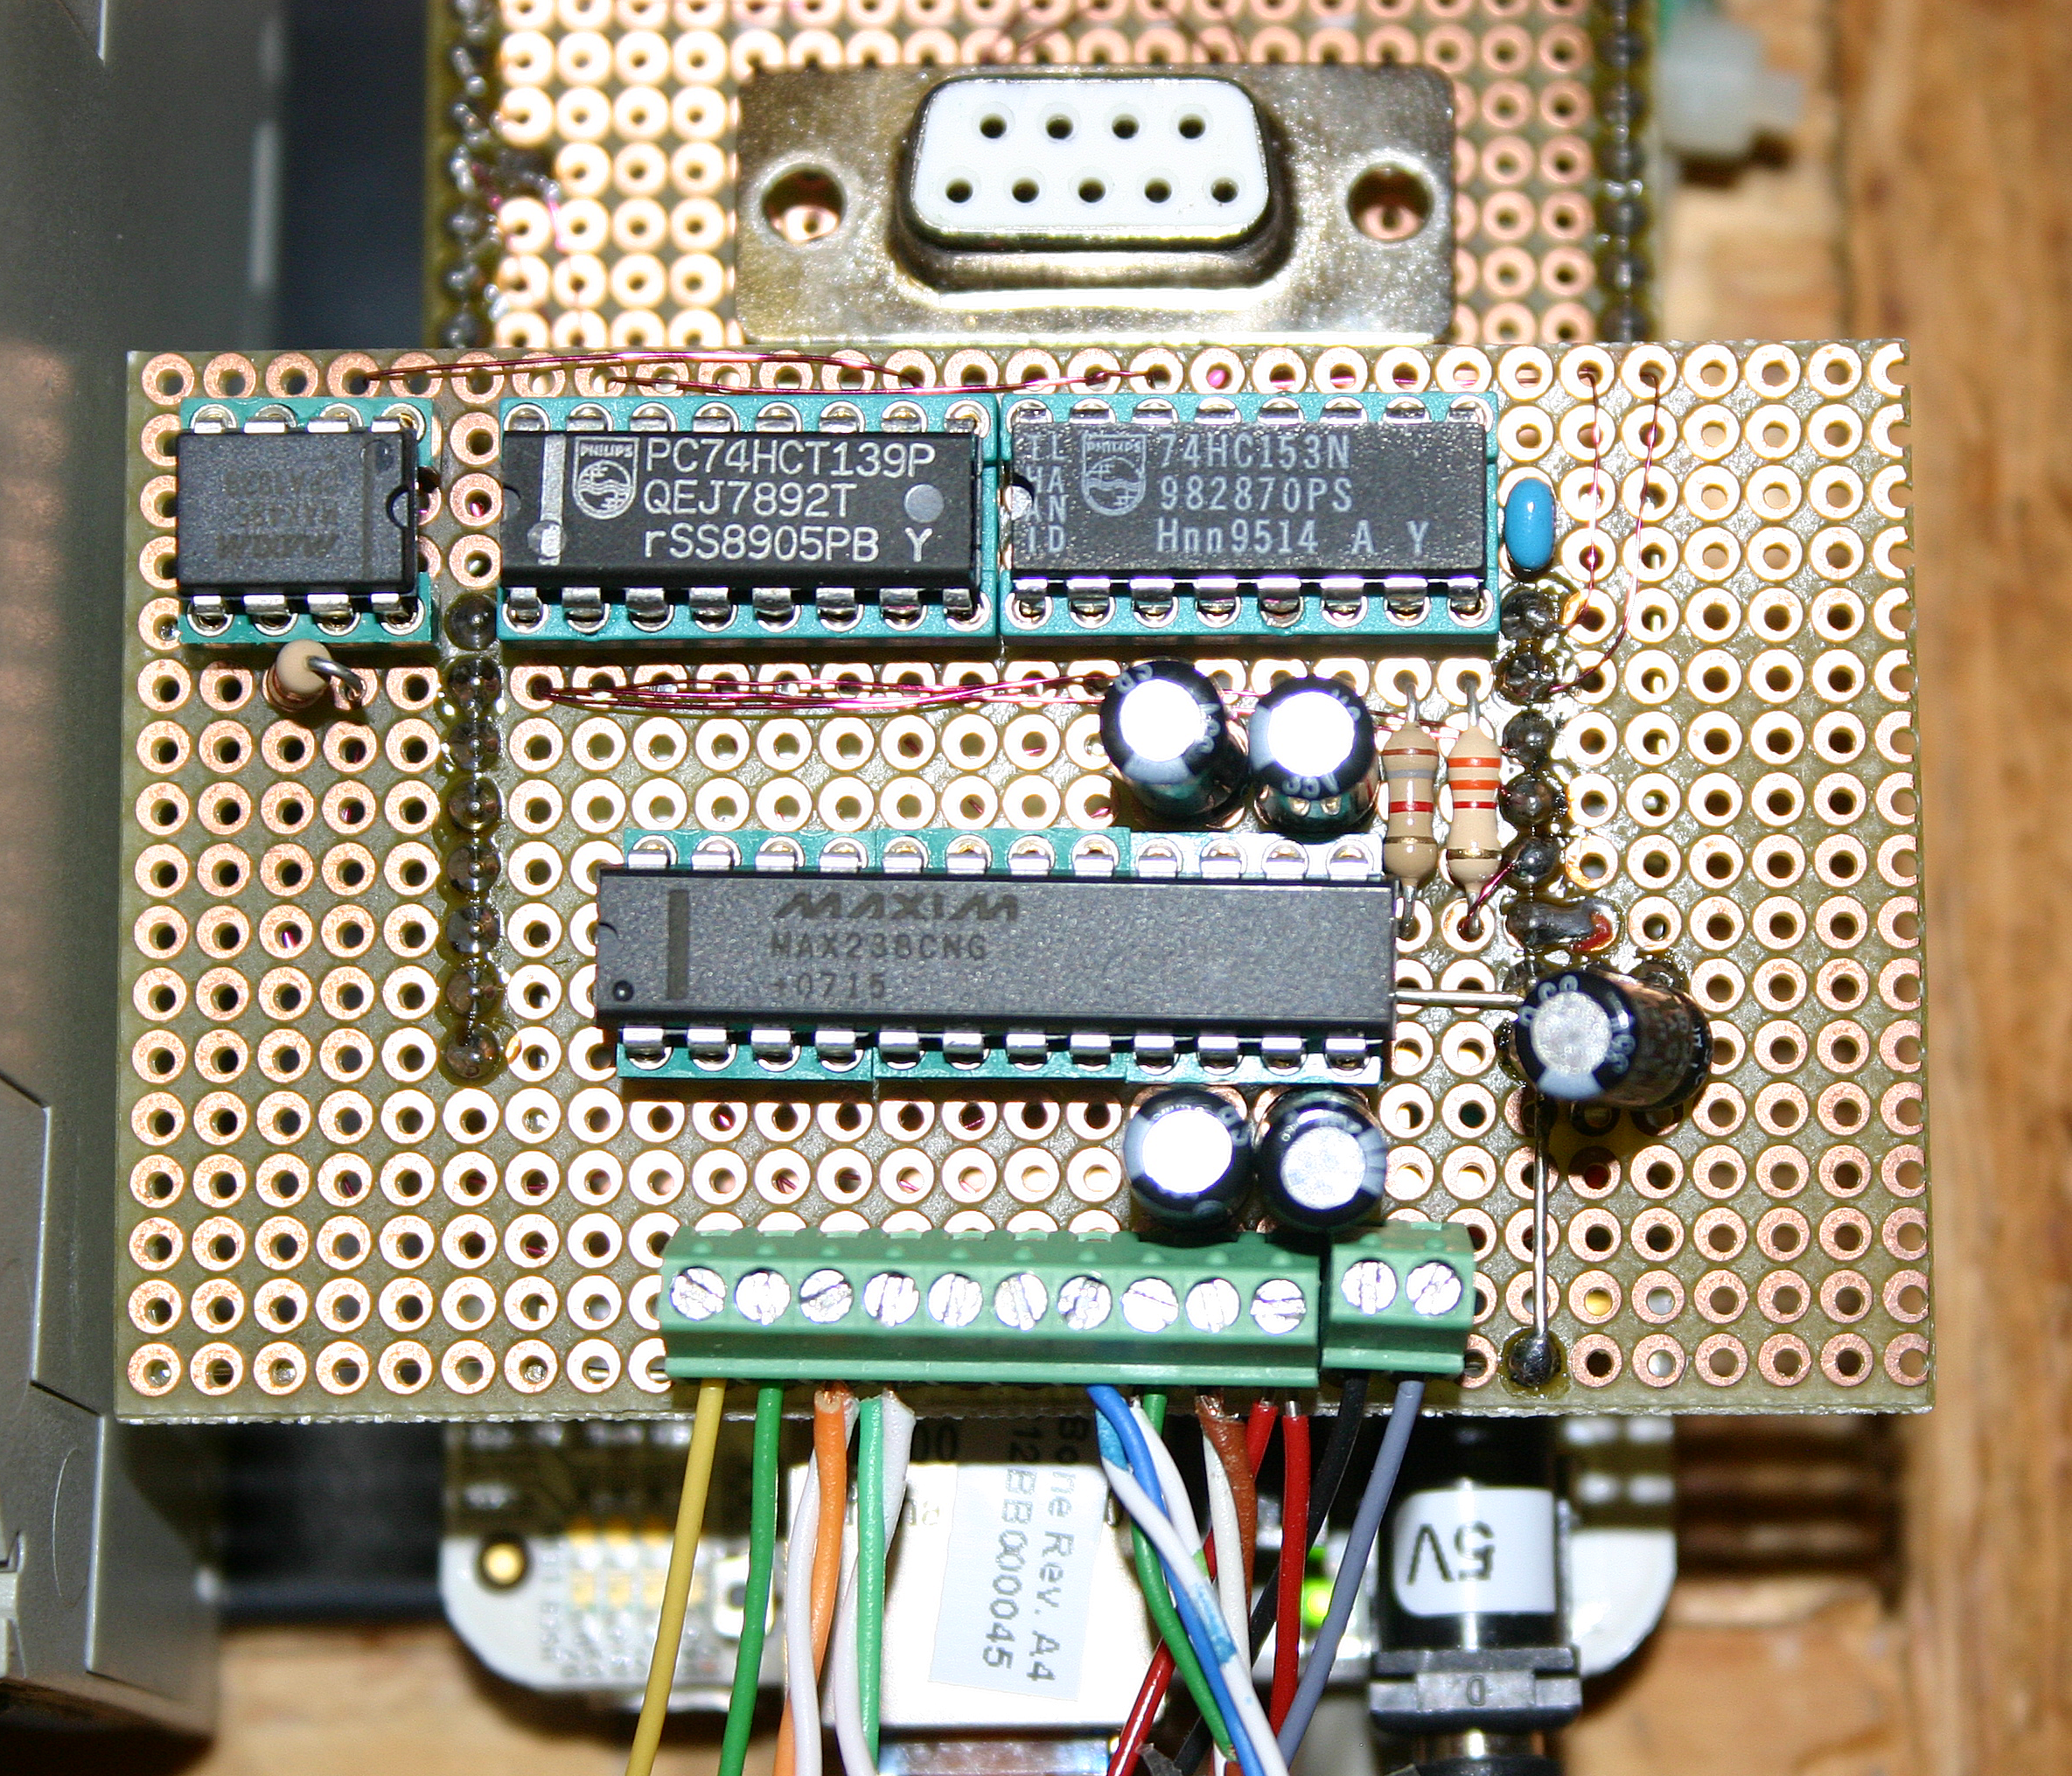
On the piggyback-board (5V) the MAX 238 is used for the same task. RX is multiplexed with half of an 74HCT153 and TX is multiplexed with half of an 74HCT139. Two GPIOs Pin 46 (GPIO 1_16 an 1_17, P9 header) are selecting one of the 4 interfaces. A voltage divider is needed to reduce the 5V to 3.3V. EIA485 (MAX 485) is half-duplex. One GPIO Pin 46 (GPIO 3_21, P9 header) helps to toggle the direction.
BeagleBone expansion without piggyback
BeagleBone expansion piggyback
Download
Kicad files (bb_expboa_kicad.zip)
Python programs and gnuplot templates(bb_python_files.zip)
The Python Code
The data is managed by 4 little python programs. A cronjob is starting the programs. The data from the teensylogger and the heating is logged every minute. The data of the three sic datalogger is collected at the end of the day and mailed at 8 am. For mor details, download the code.
/etc/crontab
* *     * * *   root    python /home/weigu/teensylogger/bb_tl_heat.py               #every minute
0 3     * * *   root    /usr/sbin/ntpdate -b -s -u pool.ntp.org                     #3h00
0 8     * * *   root    python /home/weigu/teensylogger/bb_sic_merge_plot_mail.py   #8h00
45 23   * * *   root    python /home/weigu/teensylogger/bb_sic.py                   #23h45
59 23   * * *   root    python /home/weigu/teensylogger/bb_tl_heat_move_files.py    #23h59
Code snippets
Here are some code snippets to show the mailing, uploading to a server or the generation of a gnuplot file. For mailing you have to install ssmtp:
sudo apt-get install ssmtp      # needed
sudo apt-get install mailutils  # not mandatory
sudo apt-get install mpack      # for attachments
With your editor you have to set up the defaults for SSMTP in /etc/ssmtp/ssmtp.conf. Edit the fields:
root=my@mail.adr
mailhub=smtp.xxx.xx:587
hostname=localhost
rewriteDomain=www.xxx.com
FromLineOverride=YES
AuthUser=youruserid
AuthPass=xxxxxxxxxxxx
UseSTARTTLS=YES
Test your mail with:
echo "Hello world email body" | mail -s "Test Subject" my@mail.adr
To upload files to a server you may use the ftp library (ftplib) or an sftp libbrary like paramiko:
import ftplib
import paramiko # sftp (apt-get install python-paramiko)
Mailing and uploading to a server:
def send_mail():
    try:
        mf = open (mailfile,'w')
    except IOError:
        print ("Cannot create or find file: " + mailfile)
    mf.write("Im Attachment befindet sich die Grafikdatei")
    mf.close

def upload_files_ftp():
    session = ftplib.FTP('mysite.com','mylogin','mypassword')
    try:
        upf1 = open(myfile,'rb')                  # file to send= open
    except IOError:
        print ("Cannot find file: " + myfile)
    session.cwd("mypath")
    session.storbinary('STOR myfilename', upf1)     # send the file
    upf1.close()                                    # close file and FTP
    session.quit()

def upload_files_sftp():
    host = 'mysite.com'
    port = 22
    transport = paramiko.Transport((host, port))
    password = 'mypassword'
    username = 'mylogin'
    transport.connect(username = username, password = password)
    sftp = paramiko.SFTPClient.from_transport(transport)
    upfile = 'myfilename'
    path = 'mypath' + upfile
    sftp.put(upfile,path)
    sftp.close()
    transport.close()
    print 'Upload done.'

delay(10000) #wait 10 seconds for teensylogger to complete!
merge_files()
plot_files ()
os.system('/usr/bin/gnuplot '+gnupfile2)
send_mail()
os.system('mpack -s "Mail from my BeagleBone sic" -d '+mailfile+' '+pngfile1+' my@mail.adr')
os.system('mpack -s "Mail from my BeagleBone pv" -d '+mailfile+' '+pngfile2+' my@mail.adr')
os.system('mpack -s "Mail from my BeagleBone ec" -d '+mailfile+' '+pngfile3+' my@mail.adr')
os.system('mpack -s "Mail from my BeagleBone heating" -d '+mailfile+' '+pngfile4+' my@mail.adr')
upload_files_sftp()
Generating a gnuplot file:
def plot_files():
    Title = '2014\_day'
    XFormat = "''"
    XTics = '3600*24' #seconds
    Delta = int(strftime("%j"))-1
    Begin = (datetime.today() - timedelta(days=Delta)).strftime('%d.%m.%Y')+' 23:59:00'
    End = (datetime.today() - timedelta(days=0)).strftime('%d.%m.%Y')+' 00:00:00'
    Output = pngfile1
    Input = datafile
    try:
        os.remove(gnupfile2)
    except OSError:
        pass
    try:
        gf1 = open (gnupfile1,'r')
    except IOError:
        print ("Cannot find file: " + gnupfile1)
    try:
        gf2 = open (gnupfile2,'a')
    except IOError:
        print ("Cannot find file: " + gnupfile2)
    gline1 = gf1.readline()
    while gline1 != '':
        if '%TITLE%' in gline1:
            gline1 = gline1.replace('%TITLE%',Title)
        if '%XFORMAT%' in gline1:
            gline1 = gline1.replace('%XFORMAT%',XFormat)
        if '%XTICS%' in gline1:
            gline1 = gline1.replace('%XTICS%',XTics)
        if '%BEGIN%' in gline1:
            gline1 = gline1.replace('%BEGIN%',Begin)
        if '%END%' in gline1:
            gline1 = gline1.replace('%END%',End)
        if '%OUTPUT%' in gline1:
            gline1 = gline1.replace('%OUTPUT%',Output)
        if '%INPUT%' in gline1:
            gline1 = gline1.replace('%INPUT%',Input)
        gf2.write(gline1)
        gline1 = gf1.readline()
    gf1.close
    gf2.close
A Gnuplot template file "template.gp":
reset
clear
set origin 0.02,0
set size 0.96
set key bottom center outside horizontal samplen 7 spacing 1 width 10 height 2 font ",18"
set title '%TITLE%' font ",30" offset 0,3
set style line 100 lt 1 lc rgb "black" lw 1
set grid ytics ls 100

set datafile commentschar "#"
set datafile separator "\t"

# X-Achse
set xdata time
set timefmt "%d.%m.%y %H:%M:%S"
set format x %XFORMAT%
set xtics out %XTICS% nomirror
unset mxtics
set xrange ["%BEGIN%":"%END%"]

# Y-Achsen
set yrange [0:70]
set ytics 10 font ",18"
set ylabel "kWh" font ",24" offset -3

set style fill solid border lc rgb "black"
set boxwidth 43200 absolute

plot "%INPUT%" u 1:(($4+$5+$6)/1000) axes x1y1 w boxes t 'WK\_day[kWh]' lc rgb "cyan", \
"" u 1:(($4+$5)/1000) axes x1y1 w boxes t 'WP\_day[kWh]' lc rgb "green", \
"" u 1:($5/1000) axes x1y1 w boxes t 'WG\_day[kWh]' lc rgb "red"

set terminal pngcairo size 1900,820 enhanced font 'Verdana,10'

set output "%OUTPUT%"
replot
